Your First Plugin
In this section, you’ll learn how to develop a simple Zotero plugin using the official example plugin, Make-It-Red. By the end, you will have a working plugin that modifies Zotero’s appearance. This is a simple project that is ideal for beginners who want to get familiar with Zotero plugin development.
Developing the Plugin
Before starting, ensure you have Git and NodeJS installed. Git allows you to clone (download) the project, and NodeJS is required to install and build the plugin’s dependencies.
First, open your terminal and clone the official example plugin repository:
git clone git@github.com:zotero/make-it-red.gitNext, enter the project folder and install the required dependencies (libraries the plugin needs to work):
cd ./make-it-red
npm install
Once the dependencies are installed, build the plugin by running the following command:
npm run buildThe build process will generate the plugin file build/make-it-red-2.0.xpi.
🔗 Zotero plugins use the
.xpifile extension, which contains all the plugin’s scripts and resources. See Plugin File Structure for more details.
Running the Plugin
Installing Manually
For plugin developers, it's always recommended to use Beta Builds.
🔗 When developing plugins, it’s highly recommended to use a separate profile to protect your main library. Follow this guide to create a new profile.
In the Zotero menu bar, click Tools -> Plugins to open the Plugins Manager window.
To install the plugin:
- Click the settings (⚙️) icon in the top-right of the Plugins Manager window.
- Select
Install Plugin From File...and choose thexpifile you built. - Alternatively, drag-and-drop the
xpifile into the Plugins Manager window.
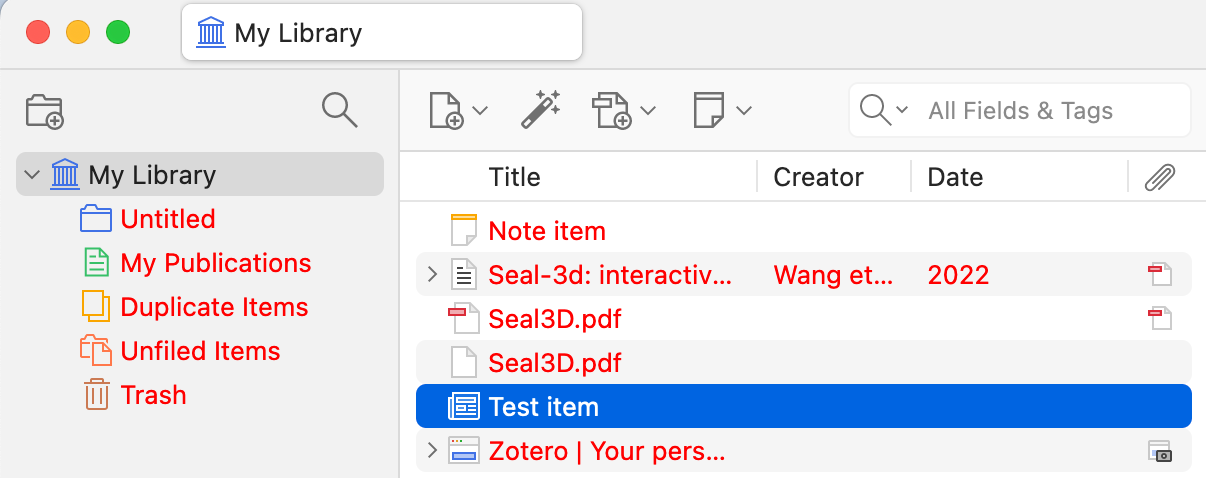
After the plugin is successfully installed, it will be listed in the Plugins Manager. You can verify that the Make-It-Red plugin works by checking the text in the items and library list—if it turns red, the installation was successful.
Loading from Source Code
It can be frustrating to manually install the plugin every time you make a change. To streamline development, you can load the plugin directly from the source code, ensuring that the latest version is used whenever Zotero is started.
After creating your plugin's source directory with sample code, you can tell Zotero to load the plugin by creating an extension proxy file. (This is a technique that used to be possible for Firefox extension development, though it's since been discontinued in Firefox.)
- Close Zotero.
- Create a text file in the
extensionsdirectory of your Zotero profile directory named after the extension id (e.g.,myplugin@mydomain.org). The file contents should be the absolute path to the root of your plugin source code directory, where yourmanifest.jsonorbootstrap.jsfile is located. - Open
prefs.jsin the Zotero profile directory in a text editor and delete the lines containingextensions.lastAppBuildIdandextensions.lastAppVersion. Save the file and restart Zotero. This will force Zotero to read the 'extensions' directory and install your plugin from the source, after which you should see it listed in Tools → Add-ons. This is only necessary once. - Whenever you make changes to your plugin code, start Zotero from the command line and pass the
-purgecachesflag to force Zotero to re-read any cached files. (This may no longer be necessary with Zotero 7.) You'll likely want to make an alias or shell script that also includes the-ZoteroDebugTextand-jsconsoleflags and perhaps-p <Profile>, where<Profile>is the name of a development profile.
💡 Try this out!
After setting up the development environment, make a change to the plugin code and see the result in Zotero. Let's make it blue, instead of red.
Modify your plugin's code and observe the changes in Zotero.
- Open
src/style.cssand changecolor: red;tocolor: blue;.- Run
npm run build, then manually reinstall the plugin.- Restart Zotero and you'll see the items list now displayed in blue.
Debugging the Plugin
Run JavaScript Window
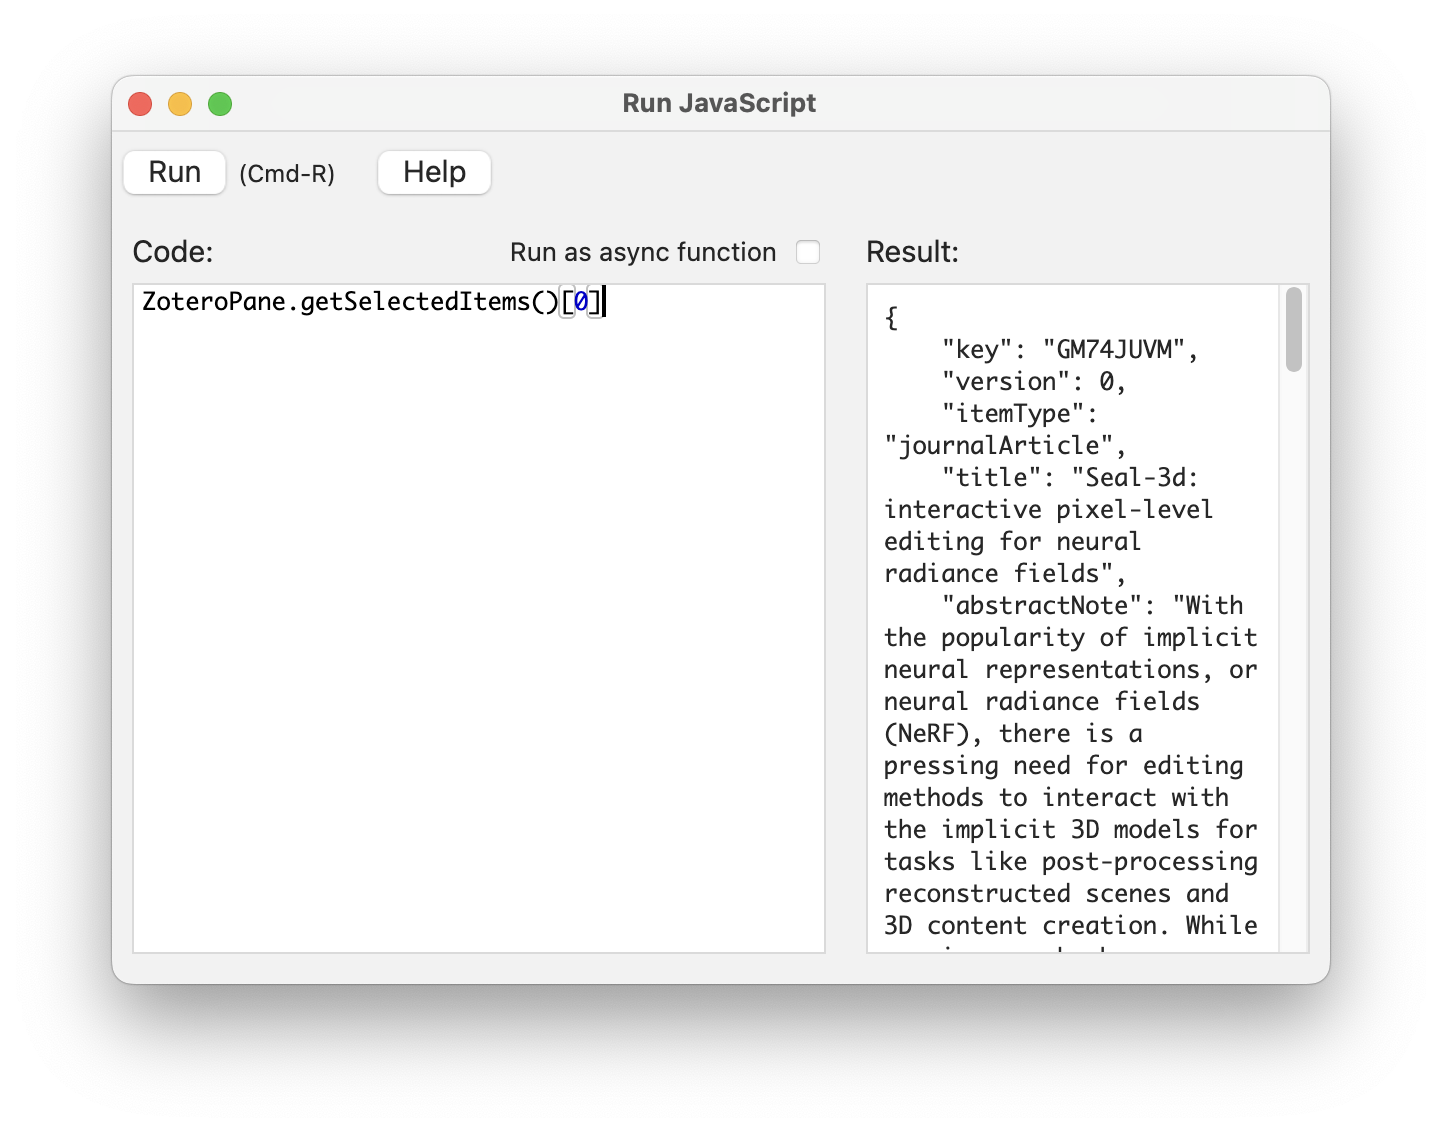
You can run JavaScript code directly in Zotero using the Run JavaScript window, which is the easiest way to test code snippets.
To access the window:
- Go to
Tools→Developer→Run JavaScript. - Type your code in the left panel.
- Click
Run, and the results will be displayed on the right.
💡 Try this out!
Select an item in the library, then run
ZoteroPane.getSelectedItems()[0]in the Run JavaScript window. This will return the first selected item in your library.
🔗 For more details about the Run JavaScript window, see Running Ad Hoc JavaScript in Zotero.
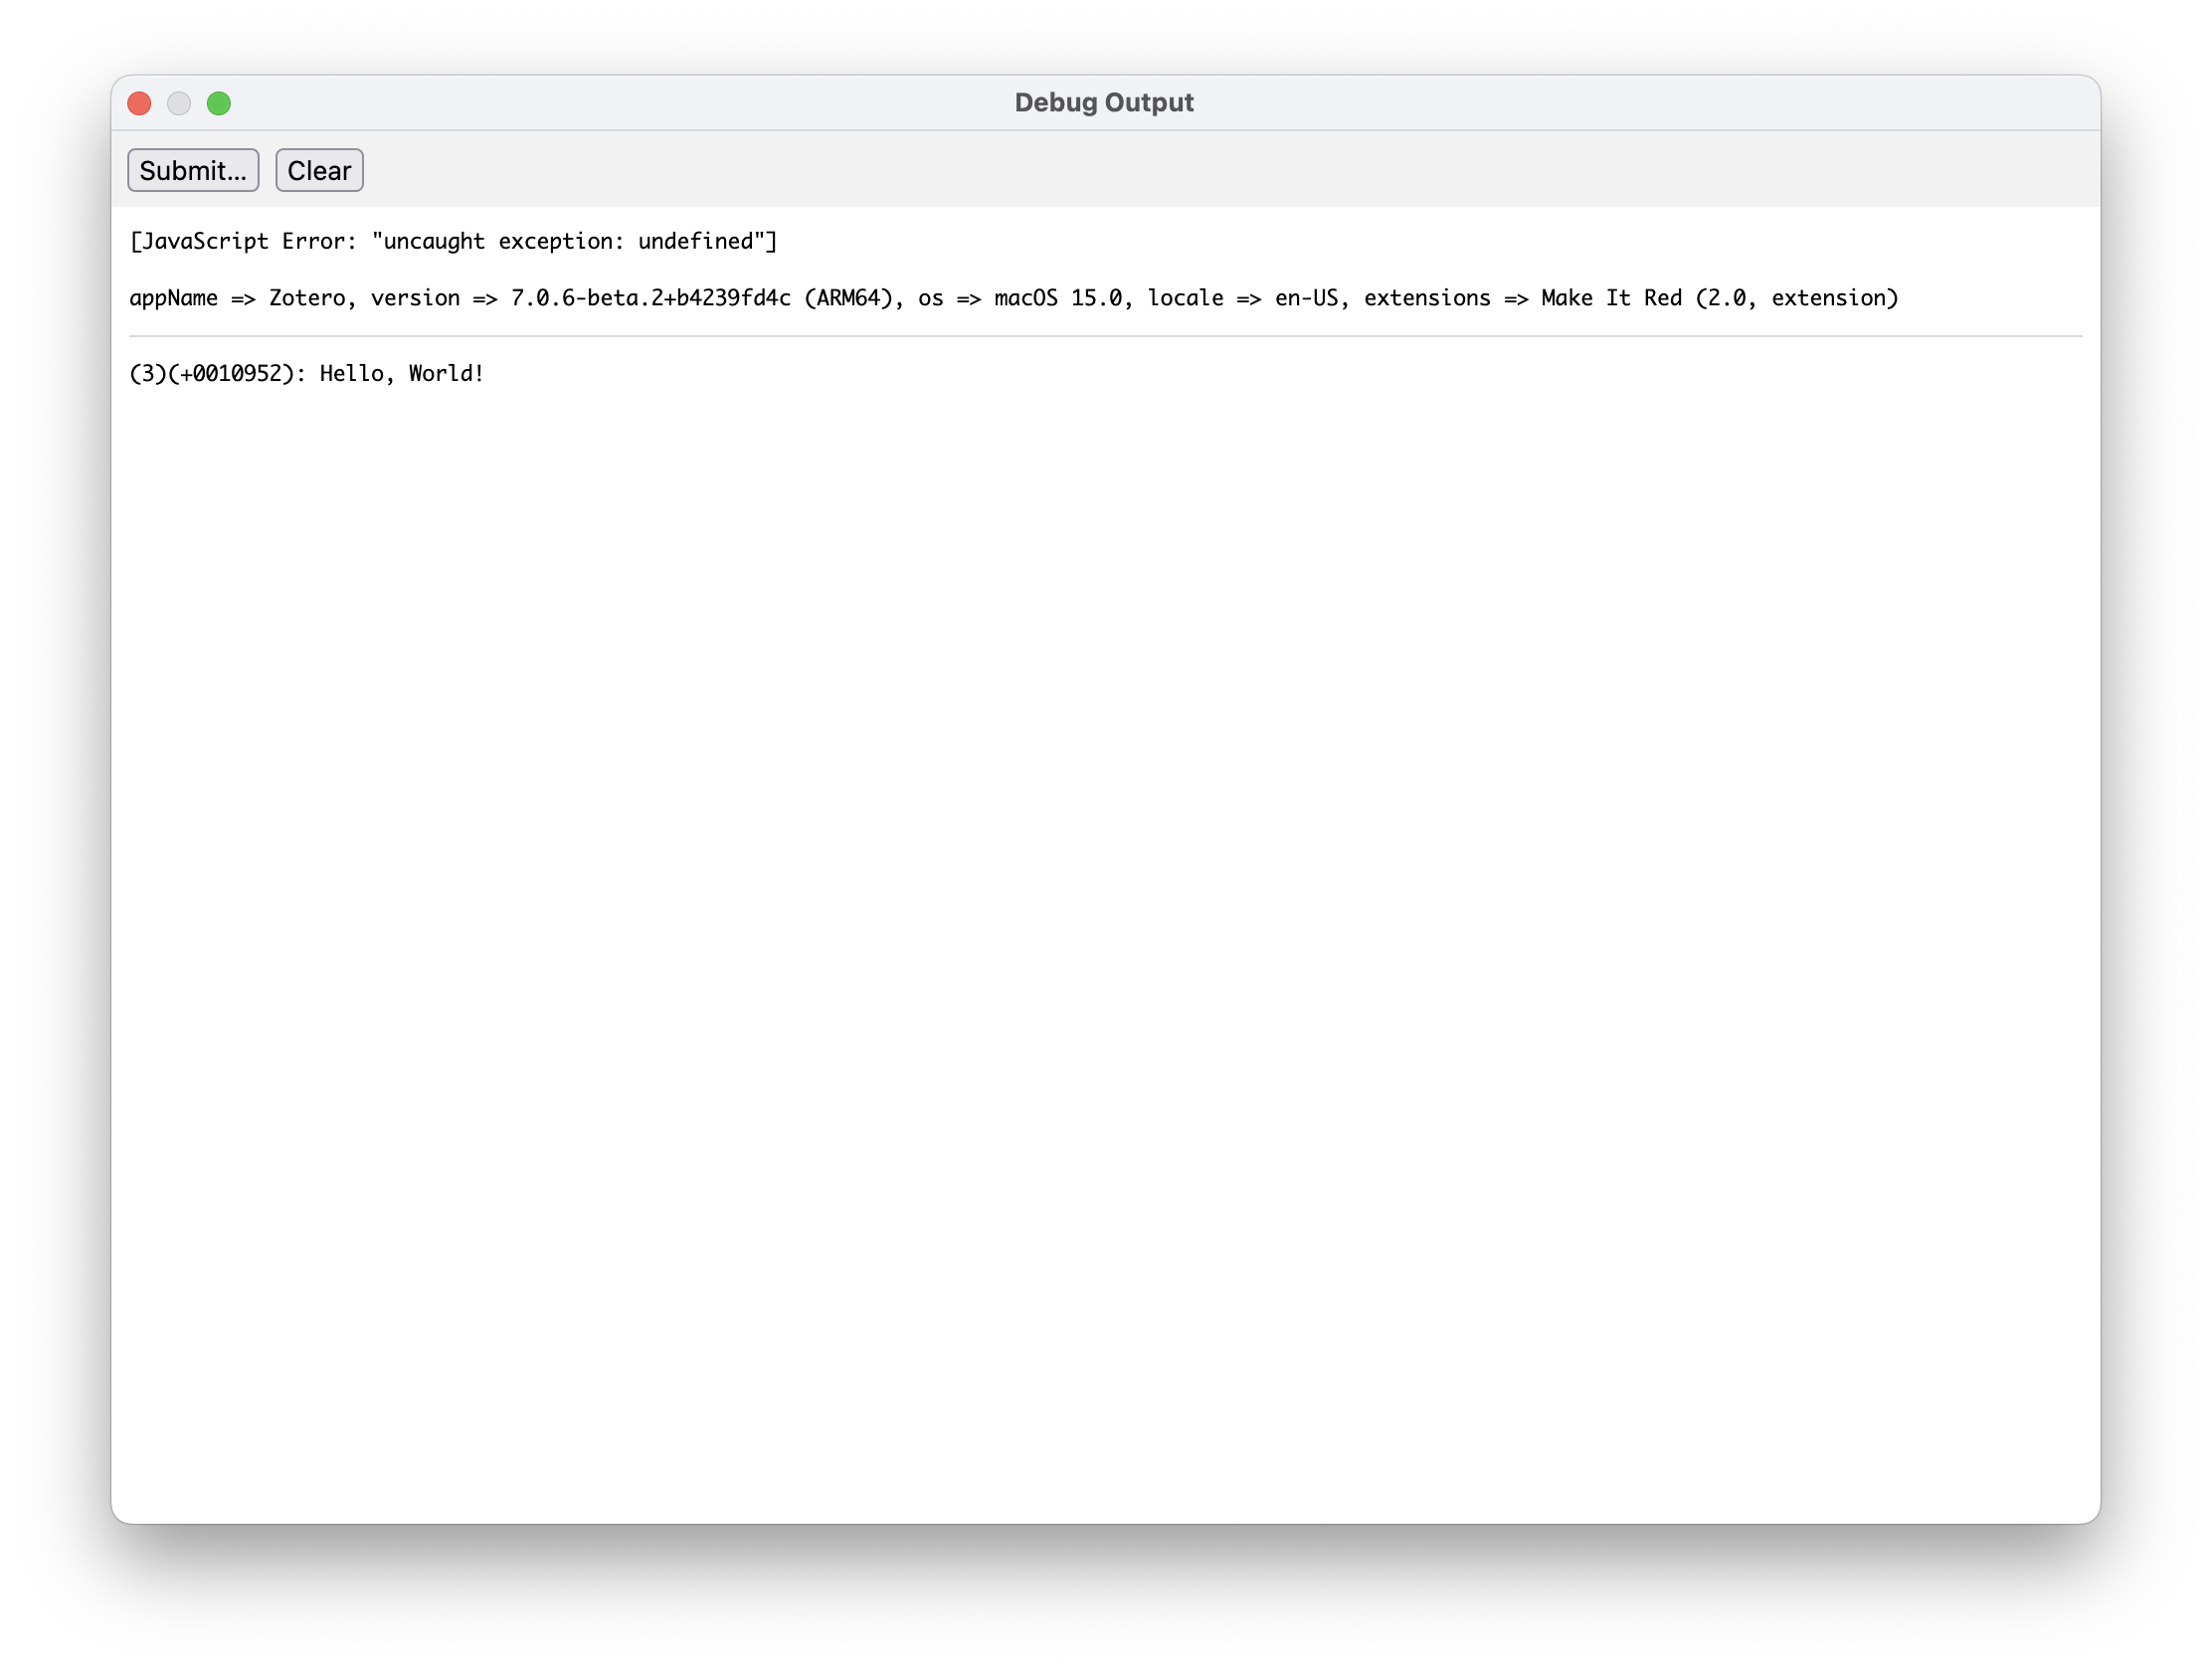
Debug Output
Zotero provides a built-in debug output system that helps developers track issues.
To log debug messages, use the Zotero.debug function. You can view the debug output by going to Help → Debug Output Logging → View Output.
💡 Try this out!
In the Run JavaScript window, run the code
Zotero.debug("Hello, World!"). Then check the debug output window to see the message.
🔗 For more details about using the debug output, see Debug Output Logging.
Although it's not possible for plugin developers to access users' debug output using the Debug ID, you can ask users to enable debug output, reproduce the issue, and send you the debug output.
DevTools
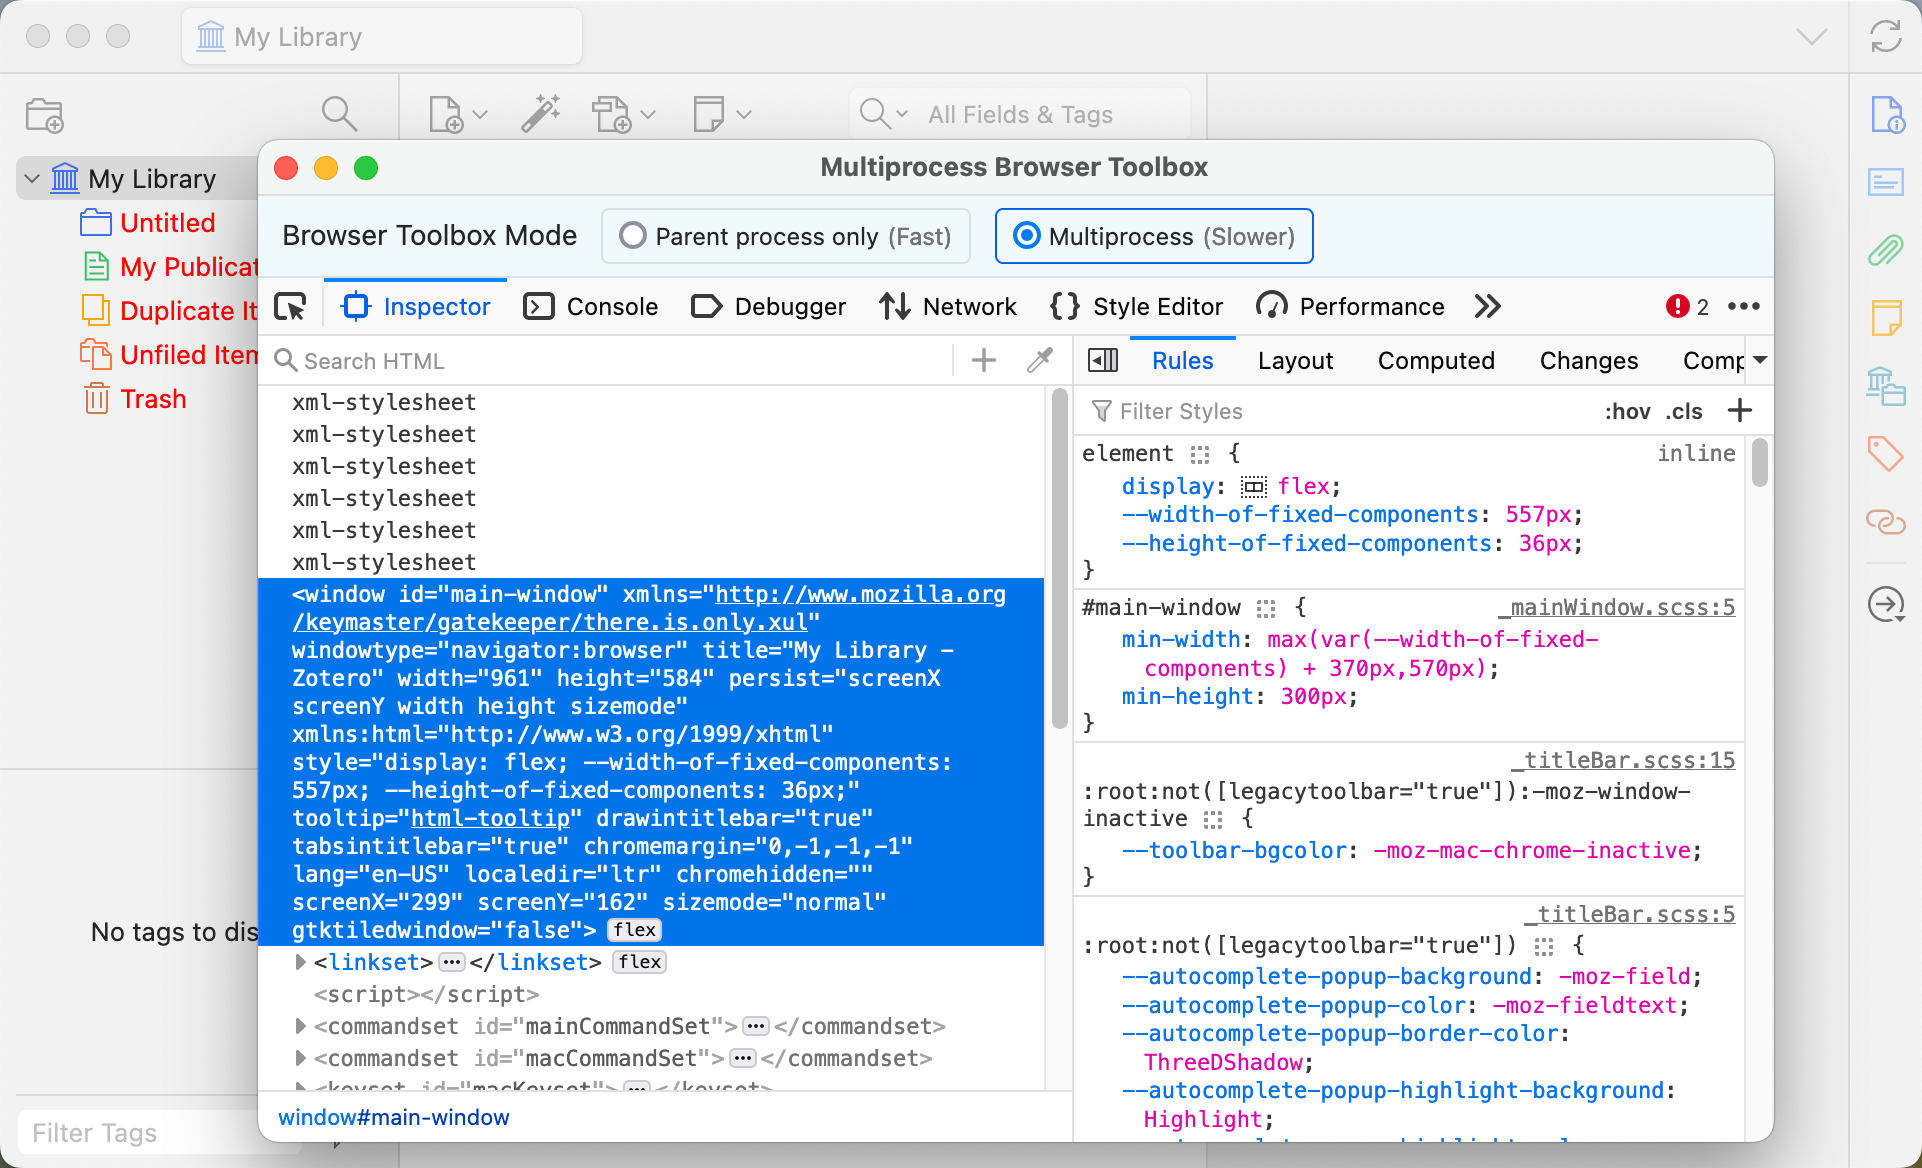
Since Zotero is built on Firefox, you can use the Firefox Developer Tools to interact with Zotero’s interface, inspect the DOM (Document Object Model), set breakpoints in your code, monitor network requests, and much more.
🔗 For a full guide to Firefox’s developer tools, refer to the Firefox DevTools User Docs.
Zotero beta builds include the Firefox 115 devtools. To start a beta build with the Browser Toolbox open, pass the -jsdebugger flag on the command line:
# the /path/to/zotero is the path to the Zotero executable
# For MacOS:
# /Applications/Zotero.app/Contents/MacOS/zotero
# For Windows:
# C:\Program Files (x86)\Zotero\zotero.exe
/path/to/zotero -ZoteroDebugText -jsdebugger
If you’re running Zotero from source code, use the -d flag with the build_and_run script, which will rebuild Zotero with devtools included and launch it with the -jsdebugger flag.
💡 Try this out!
In the Run JS window, run
Zotero.getMainWindow().console.log("Hello, World!"). Check the devtools' console to see the output.